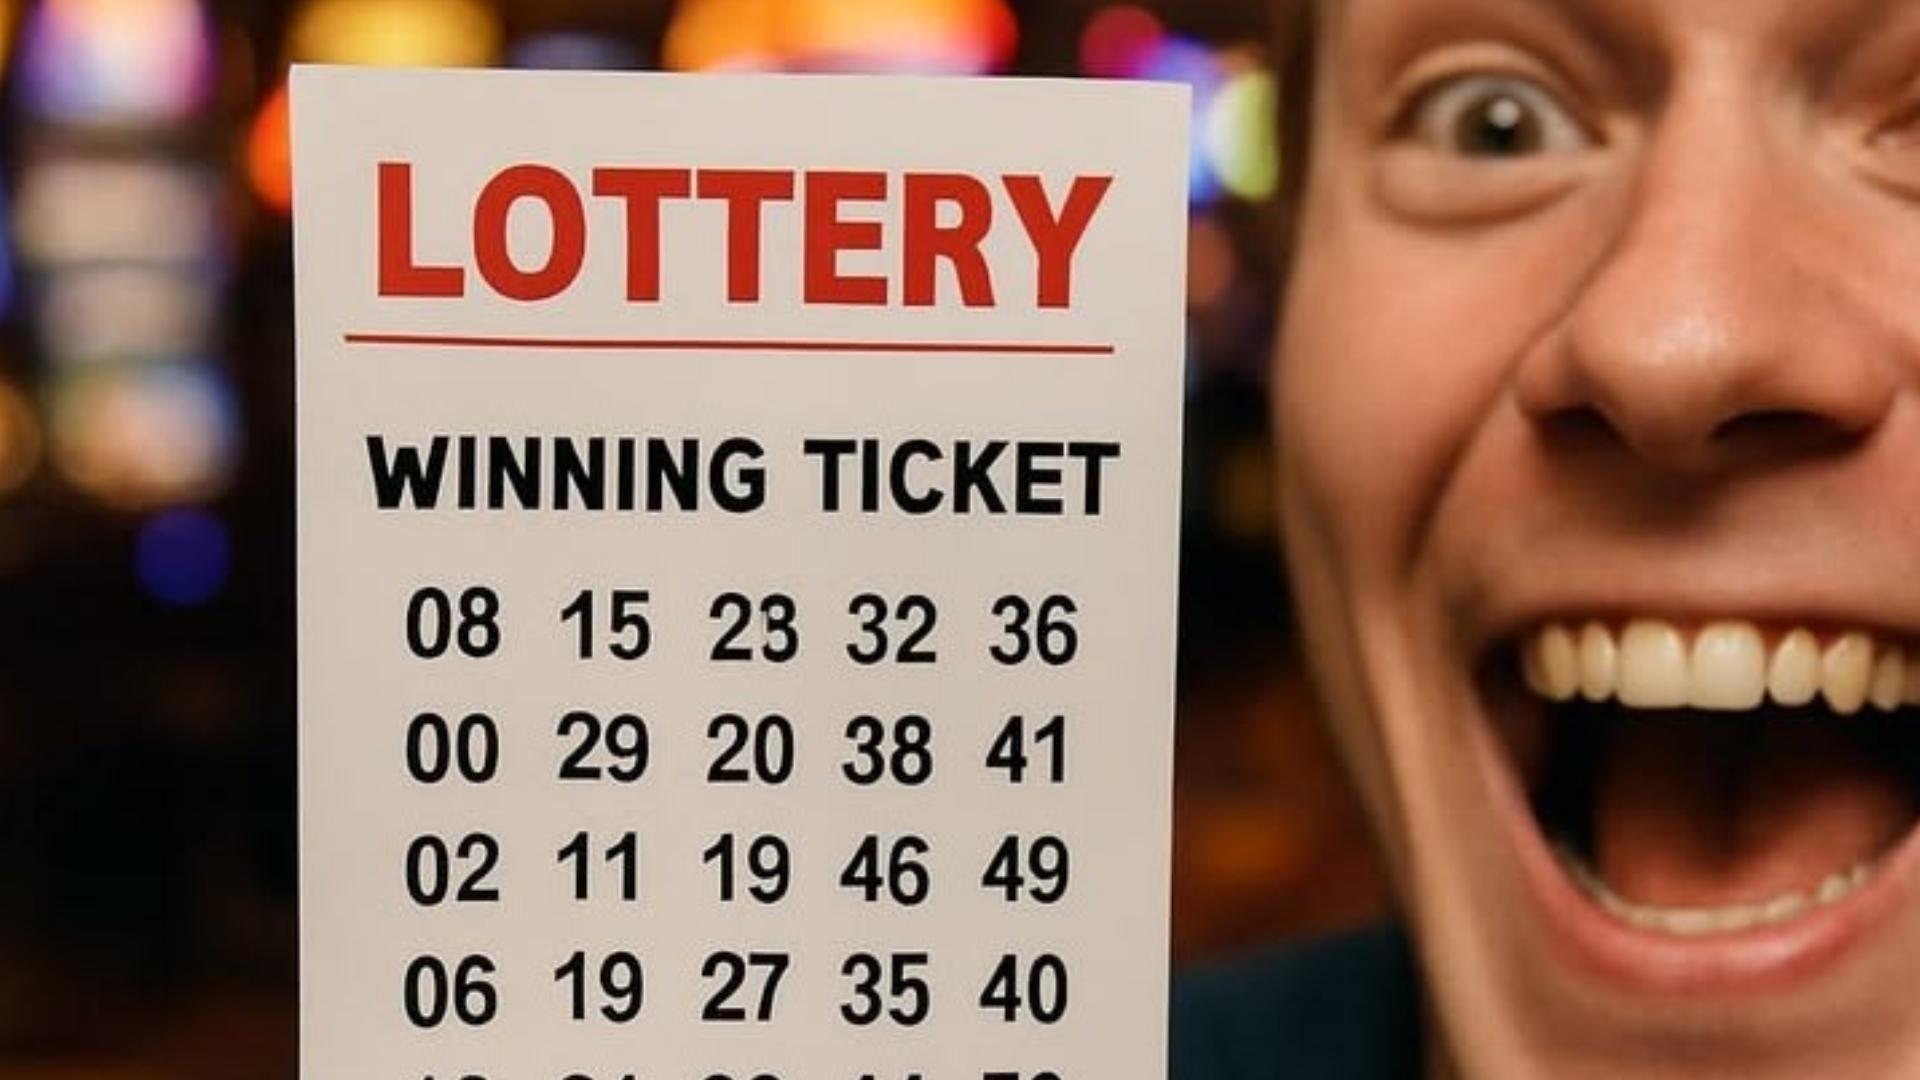
When analyzing numerical draws and lottery-style games, observing sequential values like 14 and 15 appearing together often strikes observers as unusual. Human intuition frequently interprets consecutive sequences as rare occurrences, leading many to believe that structured patterns indicate non-random outcomes. However, mathematical evaluation reveals that matching consecutive numbers is far more common in random selection processes than most people expect.
The Mathematical Reality of Sequential Draws
Probability theory demonstrates that in any sufficiently large random sample, adjacent numbers naturally cluster together at regular statistical intervals. Because each number in a pool has an identical chance of selection during an independent trial, sequential combinations hold the exact same mathematical probability as any non-consecutive pairing. Understanding this fundamental concept helps demystify how random number generators produce seemingly structured sequences.
When calculating total possible combinations across a standard number grid, the frequency of consecutive pairs remains consistently predictable. Mathematical models show that as the amount of selected numbers in a single draw increases, the likelihood of at least one consecutive pair emerging rises exponentially. Consequently, seeing adjacent values in historical draw logs should be recognized as a standard statistical feature rather than a rare anomaly.
Why Human Intuition Misinterprets Randomness
Cognitive psychology explains that the human mind naturally seeks orderly patterns within chaotic data streams to make sense of complex environments. This cognitive habit often creates a perception bias where random spreads appear normal, whereas grouped sequences like 21, 22, and 23 feel artificially engineered. Recognizing this natural mental bias allows participants to evaluate numerical results through objective mathematical principles rather than instinct.
Misinterpreting these patterns frequently leads to the belief that consecutive draws possess lower odds of occurring in future selection rounds. In truth, random selection mechanisms do not track past events or deliberately space out adjacent digits. Every individual draw resets the probability grid, ensuring that adjacent digits remain just as eligible for selection as any scattered set of numbers.
Calculating Odds Across Different Pool Sizes
The precise probability of matching two consecutive numbers depends heavily on the total pool size and how many digits are selected during each round. In smaller numerical systems, the ratio of available consecutive pairs relative to total possible combinations is surprisingly high. Analyzing these ratios provides analytical insight into how changing parameters alters overall distribution curves.
As total selection sizes expand, the overall probability shifts, yet the underlying combinatorial logic remains steady across all formats. Researchers and data analysts utilize specific formulas to calculate exact odds for various numerical games, reinforcing that sequential occurrences are fully accounted for within standard variance models. Comparing these metrics offers a grounded perspective on digital entertainment dynamics.
Practical Insights for Data Analysis
Approaching numerical data with a grounded understanding of statistical independence helps individuals avoid common analytical pitfalls. Recognizing that consecutive numbers carry standard probability values prevents reliance on flawed selection systems or superstitious grouping strategies. Treating every draw as an isolated mathematical event fosters clearer decision-making and accurate expectations.
Ultimately, developing a comprehensive understanding of numerical distributions enhances overall cognitive engagement with probability systems. By replacing subjective assumptions with solid mathematical frameworks, enthusiasts can appreciate the true nature of random selection algorithms. A balanced approach ensures that studying statistical trends remains an informative and objective endeavor.